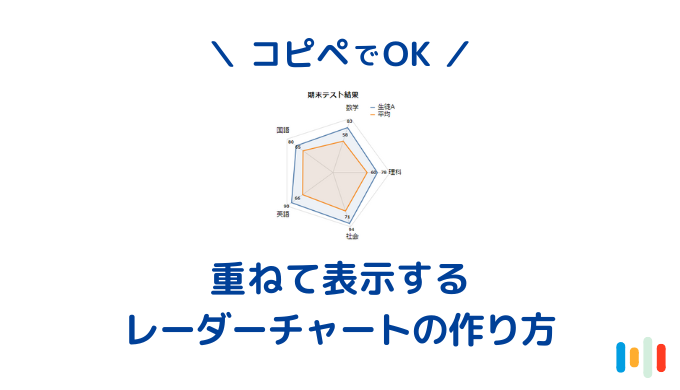


重ねて表示するレーダーチャートの作り方を教えて!
という要望をいただきましたので、コピペでそのまま使えるコードをまとめました。
ひとつのレーダーの中に、2つ以上の要素を重ねて表示して比較するレーダーチャートです。
要素が分かるよう凡例も表示しています。
このレーダーチャートを使うと、例のように、平均点と自分の点数の違いなどがひと目で比較できます。
手っ取り早くブログで使いたい方は、下の3つのコードをカスタムHTMLブロックにコピペして、記事内に埋め込めばOKです。
スクリプト
<div style="width: 100%; text-align: center;">
  <div id="radar-overlap"></div>
</div>
スクリプト
<script type="text/javascript" src="https://www.gstatic.com/charts/loader.js"></script>スクリプト
<!-- テスト結果 -->
<script type="text/javascript">
google.charts.load('upcoming', {
  'packages': ['vegachart']
}).then(loadCharts);

function loadCharts() {
  // グラフデータ
  const chartData = [
    ["国語", 80, "生徒A"],
    ["数学", 83, "生徒A"],
    ["理科", 78, "生徒A"],
    ["社会", 94, "生徒A"],
    ["英語", 90, "生徒A"],
    ["国語", 65, "平均"],
    ["数学", 58, "平均"],
    ["理科", 60, "平均"],
    ["社会", 71, "平均"],
    ["英語", 66, "平均"],
  ];
  // タイトル
  const valuetitle = "期末テスト結果";
  // 値スケール
  const valueScale = [0, 100];
  // 値フォーマット
  const valueFormat = '1';
  // レーダーの枠線の太さ
  const valueStrokeWidth = 2;
  // レーダーの領域の不透明度
  const valueOpacity = 0.1;
  // レーダーの値のフォントサイズ
  const valueValtext = 9;
  // レーダーのラベルのフォントサイズ
  const valueLabeltext = 14;
  // 凡例のX座標オフセット
  const vallegendX = 90;
  // 凡例のY座標オフセット
  const vallegendY = -150;
  // カラーリスト
  vega.scheme('colorlist', ['#367DB3', '#A73837', '#DBAE40','#DBDBD6']);

  const dataTable = new google.visualization.DataTable();
  dataTable.addColumn({
    type: 'string',
    'id': 'key'
  });
  dataTable.addColumn({
    type: 'number',
    'id': 'value'
  });
  dataTable.addColumn({
    type: 'string',
    'id': 'category'
  });
  dataTable.addRows(chartData);

  const options = {
    'vega': {
      "$schema": "https://vega.github.io/schema/vega/v5.json",
      "width": 350,
      "height": 350,
      "padding": 50,
      "autosize": {
        "type": "none",
        "contains": "padding"
      },

      "title": {
        "text": valuetitle,
        "anchor": "middle",
        "fontSize": 16,
        "dy": -8,
        "dx": {
          "signal": "-width/4"
        },
        "subtitle": ""
      },

      "signals": [{
        "name": "radius",
        "update": "width/2"
      }],
      "data": [{
          "name": "table",
          "source": "datatable",
        },
        {
          "name": "keys",
          "source": "table",
          "transform": [{
            "type": "aggregate",
            "groupby": ["key"]
          }]
        }
      ],
      "scales": [{
          "name": "angular",
          "type": "point",
          "range": {
            "signal": "[-PI, PI]"
          },
          "padding": 0.5,
          "domain": {
            "data": "table",
            "field": "key"
          }
        },
        {
          "name": "radial",
          "type": "linear",
          "range": {
            "signal": "[0, radius]"
          },
          "zero": true,
          "nice": false,
          "domain": valueScale,
        },
        {
          "name": "color",
          "type": "ordinal",
          "domain": {
            "data": "table",
            "field": "category"
          },
          "range": {
            "scheme": "colorlist"
          }
        }
      ],
      "encode": {
        "enter": {
          "x": {
            "signal": "width/2"
          },
          "y": {
            "signal": "height/2 + 20"
          }
        }
      },

      "legends": [{
        "stroke": "color",
        "symbolType": "stroke",
        "orient": "none",
        "legendX": vallegendX,
        "legendY": vallegendY,
        "fill": "color",
        "labelFontSize": valueLabeltext,
      }],

      "marks": [{
          "type": "group",
          "name": "categories",
          "zindex": 1,
          "from": {
            "facet": {
              "data": "table",
              "name": "facet",
              "groupby": ["category"]
            }
          },
          "marks": [{
              "type": "line",
              "name": "category-line",
              "from": {
                "data": "facet"
              },
              "encode": {
                "enter": {
                  "interpolate": {
                    "value": "linear-closed"
                  },
                  "x": {
                    "signal": "scale('radial', datum.value) * cos(scale('angular', datum.key))"
                  },
                  "y": {
                    "signal": "scale('radial', datum.value) * sin(scale('angular', datum.key))"
                  },
                  "stroke": {
                    "scale": "color",
                    "field": "category"
                  },
                  "strokeWidth": {
                    "value": valueStrokeWidth
                  },
                  "fill": {
                    "scale": "color",
                    "field": "category"
                  },
                  "fillOpacity": {
                    "value": valueOpacity
                  }
                }
              }
            },
            {
              "type": "text",
              "name": "value-text",
              "from": {
                "data": "category-line"
              },
              "encode": {
                "enter": {
                  "x": {
                    "signal": "datum.x + 14 * cos(scale('angular', datum.datum.key))"
                  },
                  "y": {
                    "signal": "datum.y + 14 * sin(scale('angular', datum.datum.key))"
                  },
                  "text": {
                    "signal": "format(datum.datum.value,'1')"
                  },
                  "opacity": {
                    "signal": "datum.datum.value > 0.01 ? 1 : 0"
                  },
                  "align": {
                    "value": "center"
                  },
                  "baseline": {
                    "value": "middle"
                  },
                  "fontWeight": {
                    "value": "bold"
                  },
                  "fill": {
                    "value": "black",
                  },
                  "fontSize": {
                    "value": valueValtext
                  }
                }
              }
            }
          ]
        },
        {
          "type": "rule",
          "name": "radial-grid",
          "from": {
            "data": "keys"
          },
          "zindex": 0,
          "encode": {
            "enter": {
              "x": {
                "value": 0
              },
              "y": {
                "value": 0
              },
              "x2": {
                "signal": "radius * cos(scale('angular', datum.key))"
              },
              "y2": {
                "signal": "radius * sin(scale('angular', datum.key))"
              },
              "stroke": {
                "value": "lightgray"
              },
              "strokeWidth": {
                "value": 1
              }
            }
          }
        },
        {
          "type": "text",
          "name": "key-label",
          "from": {
            "data": "keys"
          },
          "zindex": 1,
          "encode": {
            "enter": {
              "x": {
                "signal": "(radius + 11) * cos(scale('angular', datum.key))"
              },
              "y": [{
                  "test": "sin(scale('angular', datum.key)) > 0",
                  "signal": "5 + (radius + 11) * sin(scale('angular', datum.key))"
                },
                {
                  "test": "sin(scale('angular', datum.key)) < 0",
                  "signal": "-5 + (radius + 11) * sin(scale('angular', datum.key))"
                },
                {
                  "signal": "(radius + 11) * sin(scale('angular', datum.key))"
                }
              ],
              "text": {
                "field": "key"
              },
              "align": {
                "value": "center"
              },
              "baseline": [{
                  "test": "scale('angular', datum.key) > 0",
                  "value": "top"
                },
                {
                  "test": "scale('angular', datum.key) == 0",
                  "value": "middle"
                },
                {
                  "value": "bottom"
                }
              ],
              "fill": {
                "value": "#666"
              },
              "fontSize": {
                "value": valueLabeltext
              }
            }
          }
        },
        {
          "type": "line",
          "name": "outer-line",
          "from": {
            "data": "radial-grid"
          },
          "encode": {
            "enter": {
              "interpolate": {
                "value": "linear-closed"
              },
              "x": {
                "field": "x2"
              },
              "y": {
                "field": "y2"
              },
              "stroke": {
                "value": "lightgray"
              },
              "strokeWidth": {
                "value": 1
              }
            }
          }
        }
      ]
    }
  }

  const elem = document.createElement("div");
  elem.setAttribute("style", "display: inline-block; width: 350px; height: 350px; font-size: initial;");

  const chart = new google.visualization.VegaChart(elem);
  chart.draw(dataTable, options);

  document.getElementById("radar-overlap").appendChild(elem);
}

</script>GoogleChartsの使い方は、こちらの記事をみてください。
 WordPressブログにグラフを埋めこむためのGoogleChartsの使い方
GoogleChartsのレーダーチャートの基本的な使い方は、こちらの記事をみてください。
 【コピペでGoogleCharts】レーダーチャートの使い方